Need a tailor-made Laravel web application? Here’s how we bring it to life.
4 min read
Why Are We So Excited About Laravel Nightwatch?
The Laravel core team keeps raising the bar, and we couldn’t be more excited with their latest reveal at Laracon AU 2024. This time, Taylor Otwell and Jess Archer introduced Laravel Nightwatch - a first-class, Laravel-specific monitoring tool designed to give us deep insights and a seamless view into our apps' health and performance.
With Nightwatch, we’re expecting a single, unified look at everything that matters in our applications, from requests and jobs to exceptions and scheduled tasks - all without the usual configuration hassle.
Early access for Nightwatch is expected to roll out in Q1 2025, and we’re already counting down the days. But before it officially launches, let’s break down why we’re so excited about what Nightwatch could bring to our monitoring workflow and why we think it will be transformational for Laravel development teams everywhere.
Laravel Nightwatch - All-In-One Monitoring Solution
Here at Redberry, monitoring our applications’ health currently means managing a mix of different tools, including Sentry, AWS CloudWatch, Laravel Telescope, and Laravel Horizon, to cover everything from error tracking and logs to server health and job analytics. And, to be honest, juggling all these tools is a big challenge. Having to switch between them makes it harder to get a clear, unified view of our applications’ health and performance.
This is exactly where Laravel Nightwatch promises to make a huge difference. With Nightwatch’s robust feature set, we can potentially move away from our fragmented toolkit and bring everything we need into one Laravel-optimized platform. Nightwatch is obsessively optimized for Laravel, meaning it’s designed to work with our framework without any configuration overhead and deliver insights that are highly relevant to Laravel applications.
In one seamless view, Nightwatch could allow us to monitor everything - errors, jobs, logs, and more - without jumping between different tools. This all-in-one approach doesn’t just simplify our setup; it has the potential to really transform the developer experience.
Key Points Behind Laravel Nightwatch
-
Purpose-Built for Laravel: Nightwatch is designed from the ground up specifically for Laravel, allowing it to integrate seamlessly with our Laravel applications without the extensive configuration other tools require.
-
Visually Impressive and Intuitive Interface: The Nightwatch interface is not only sleek but user-friendly, making it easy for developers to navigate and interpret metrics at a glance.
-
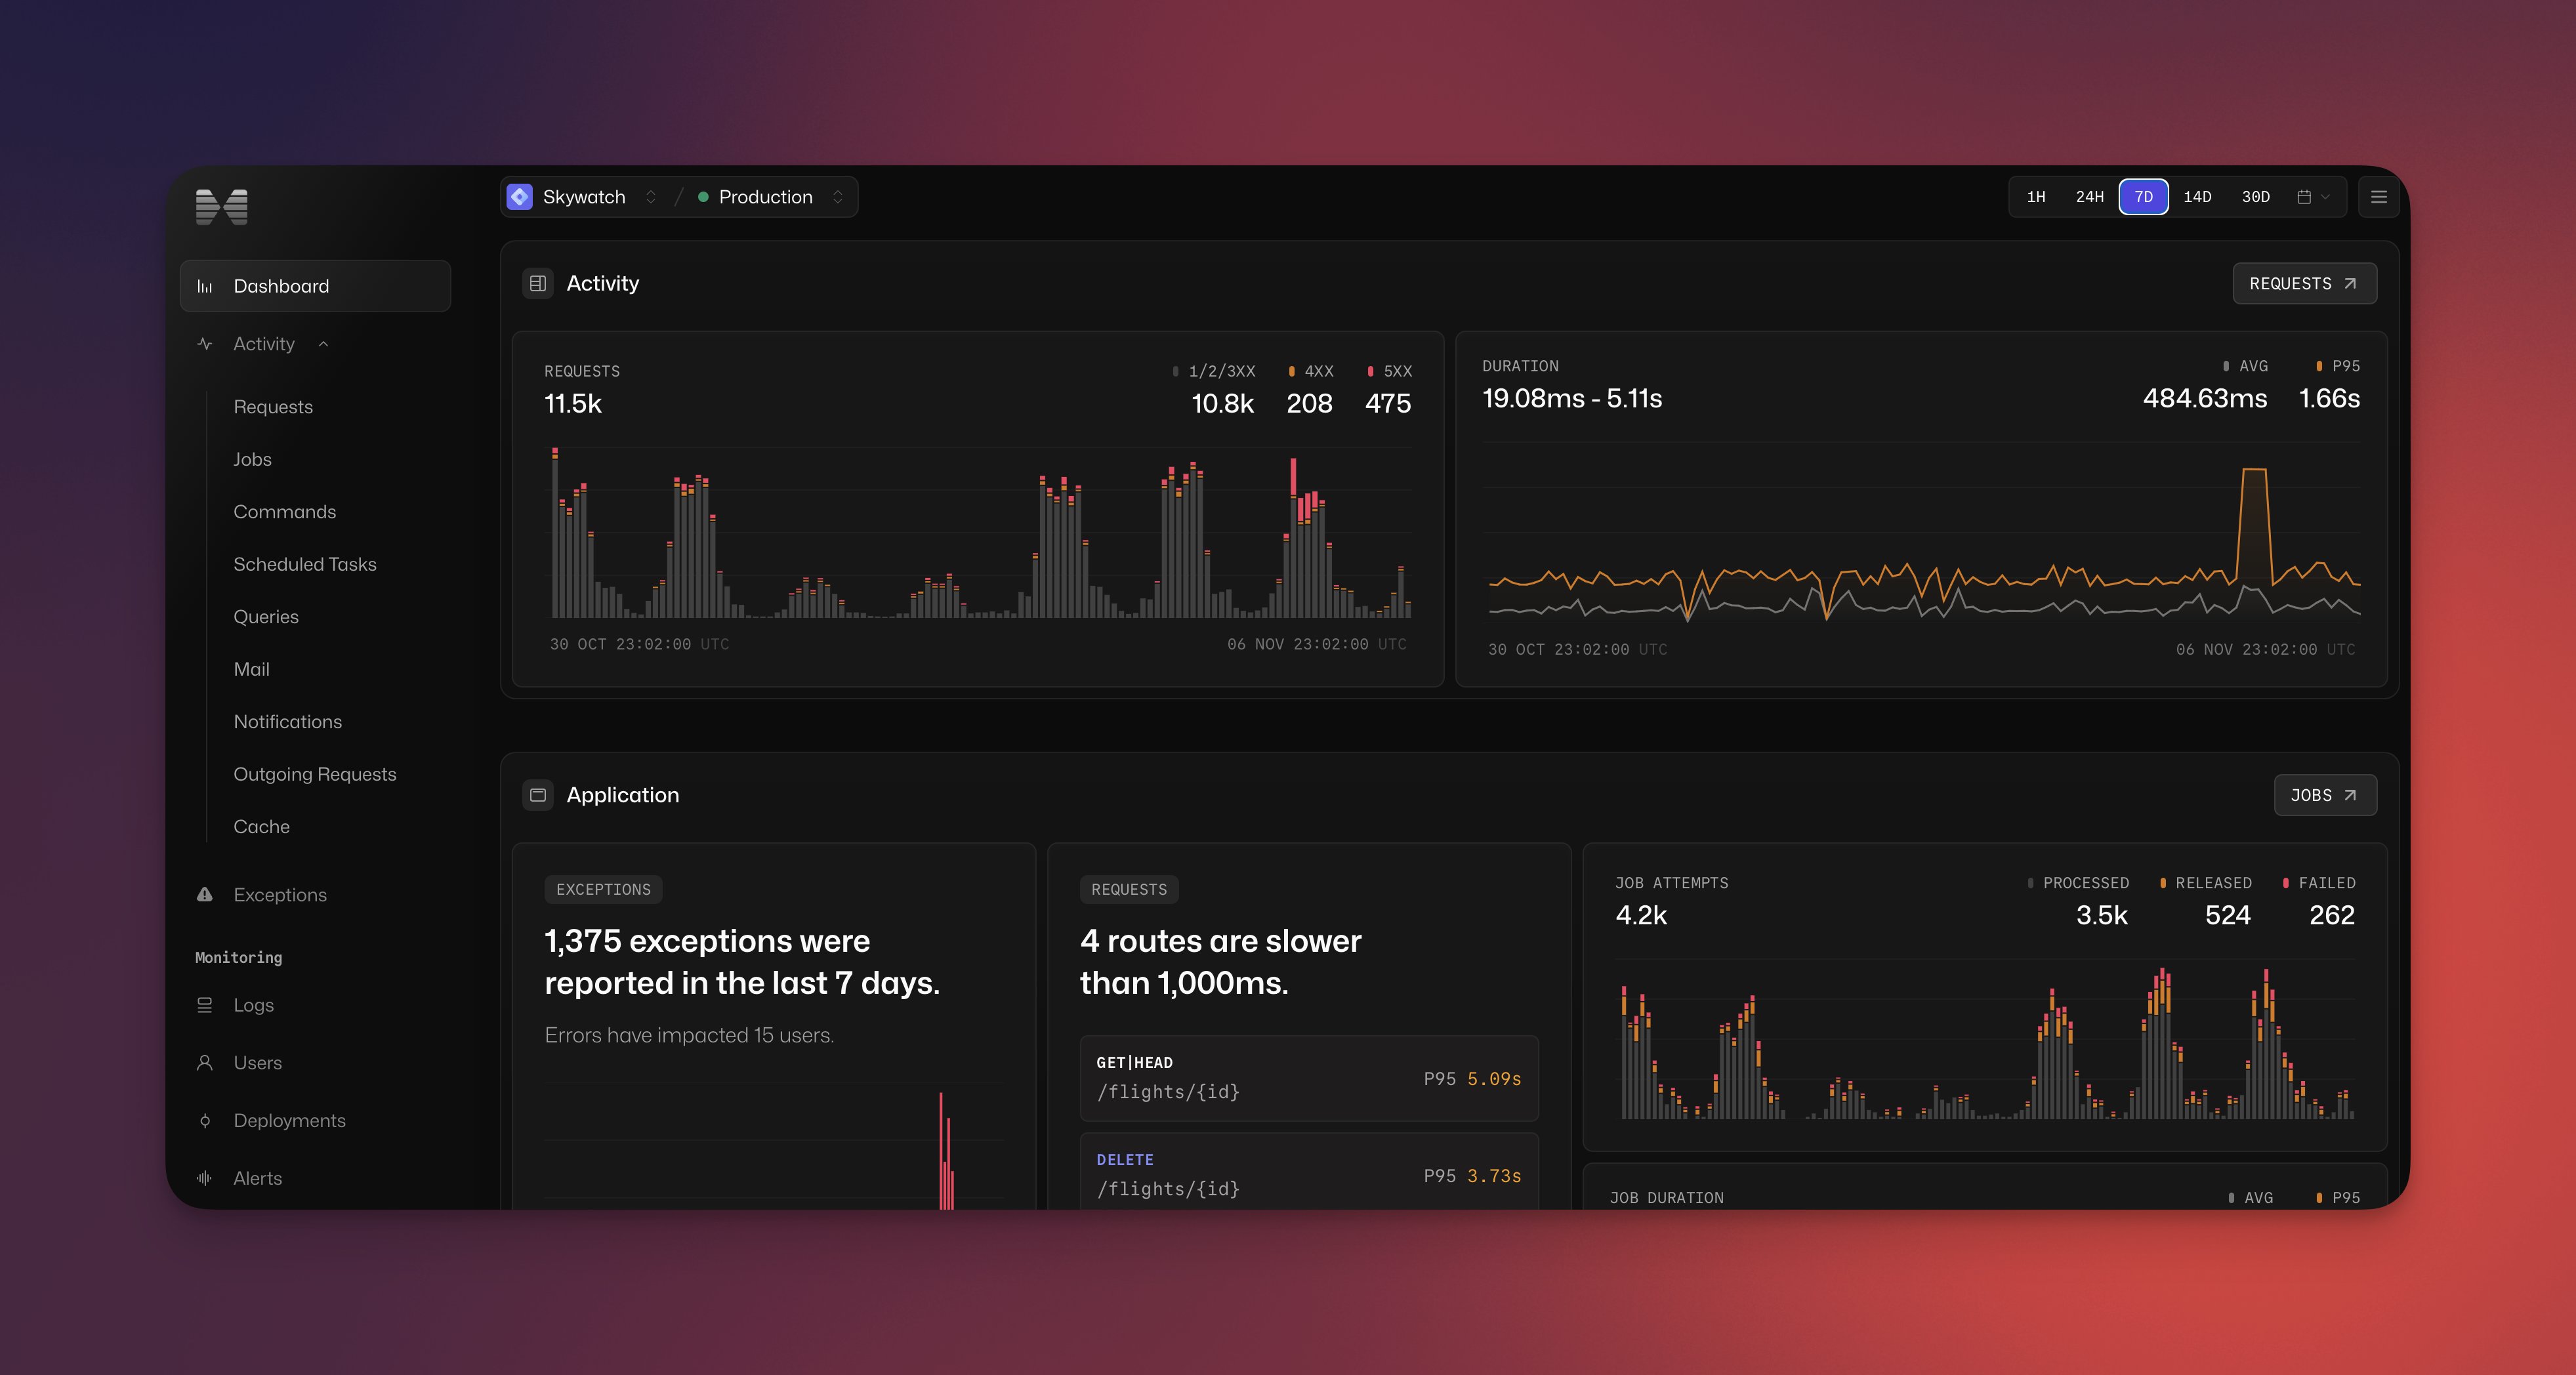
Comprehensive Monitoring Dashboard: The Nightwatch dashboard gives us a powerful overview of application health, including real-time metrics on requests, queued jobs, server health, and more. This high-level view allows us to monitor application performance at a glance, ensuring faster detection and diagnosis of potential issues.
-
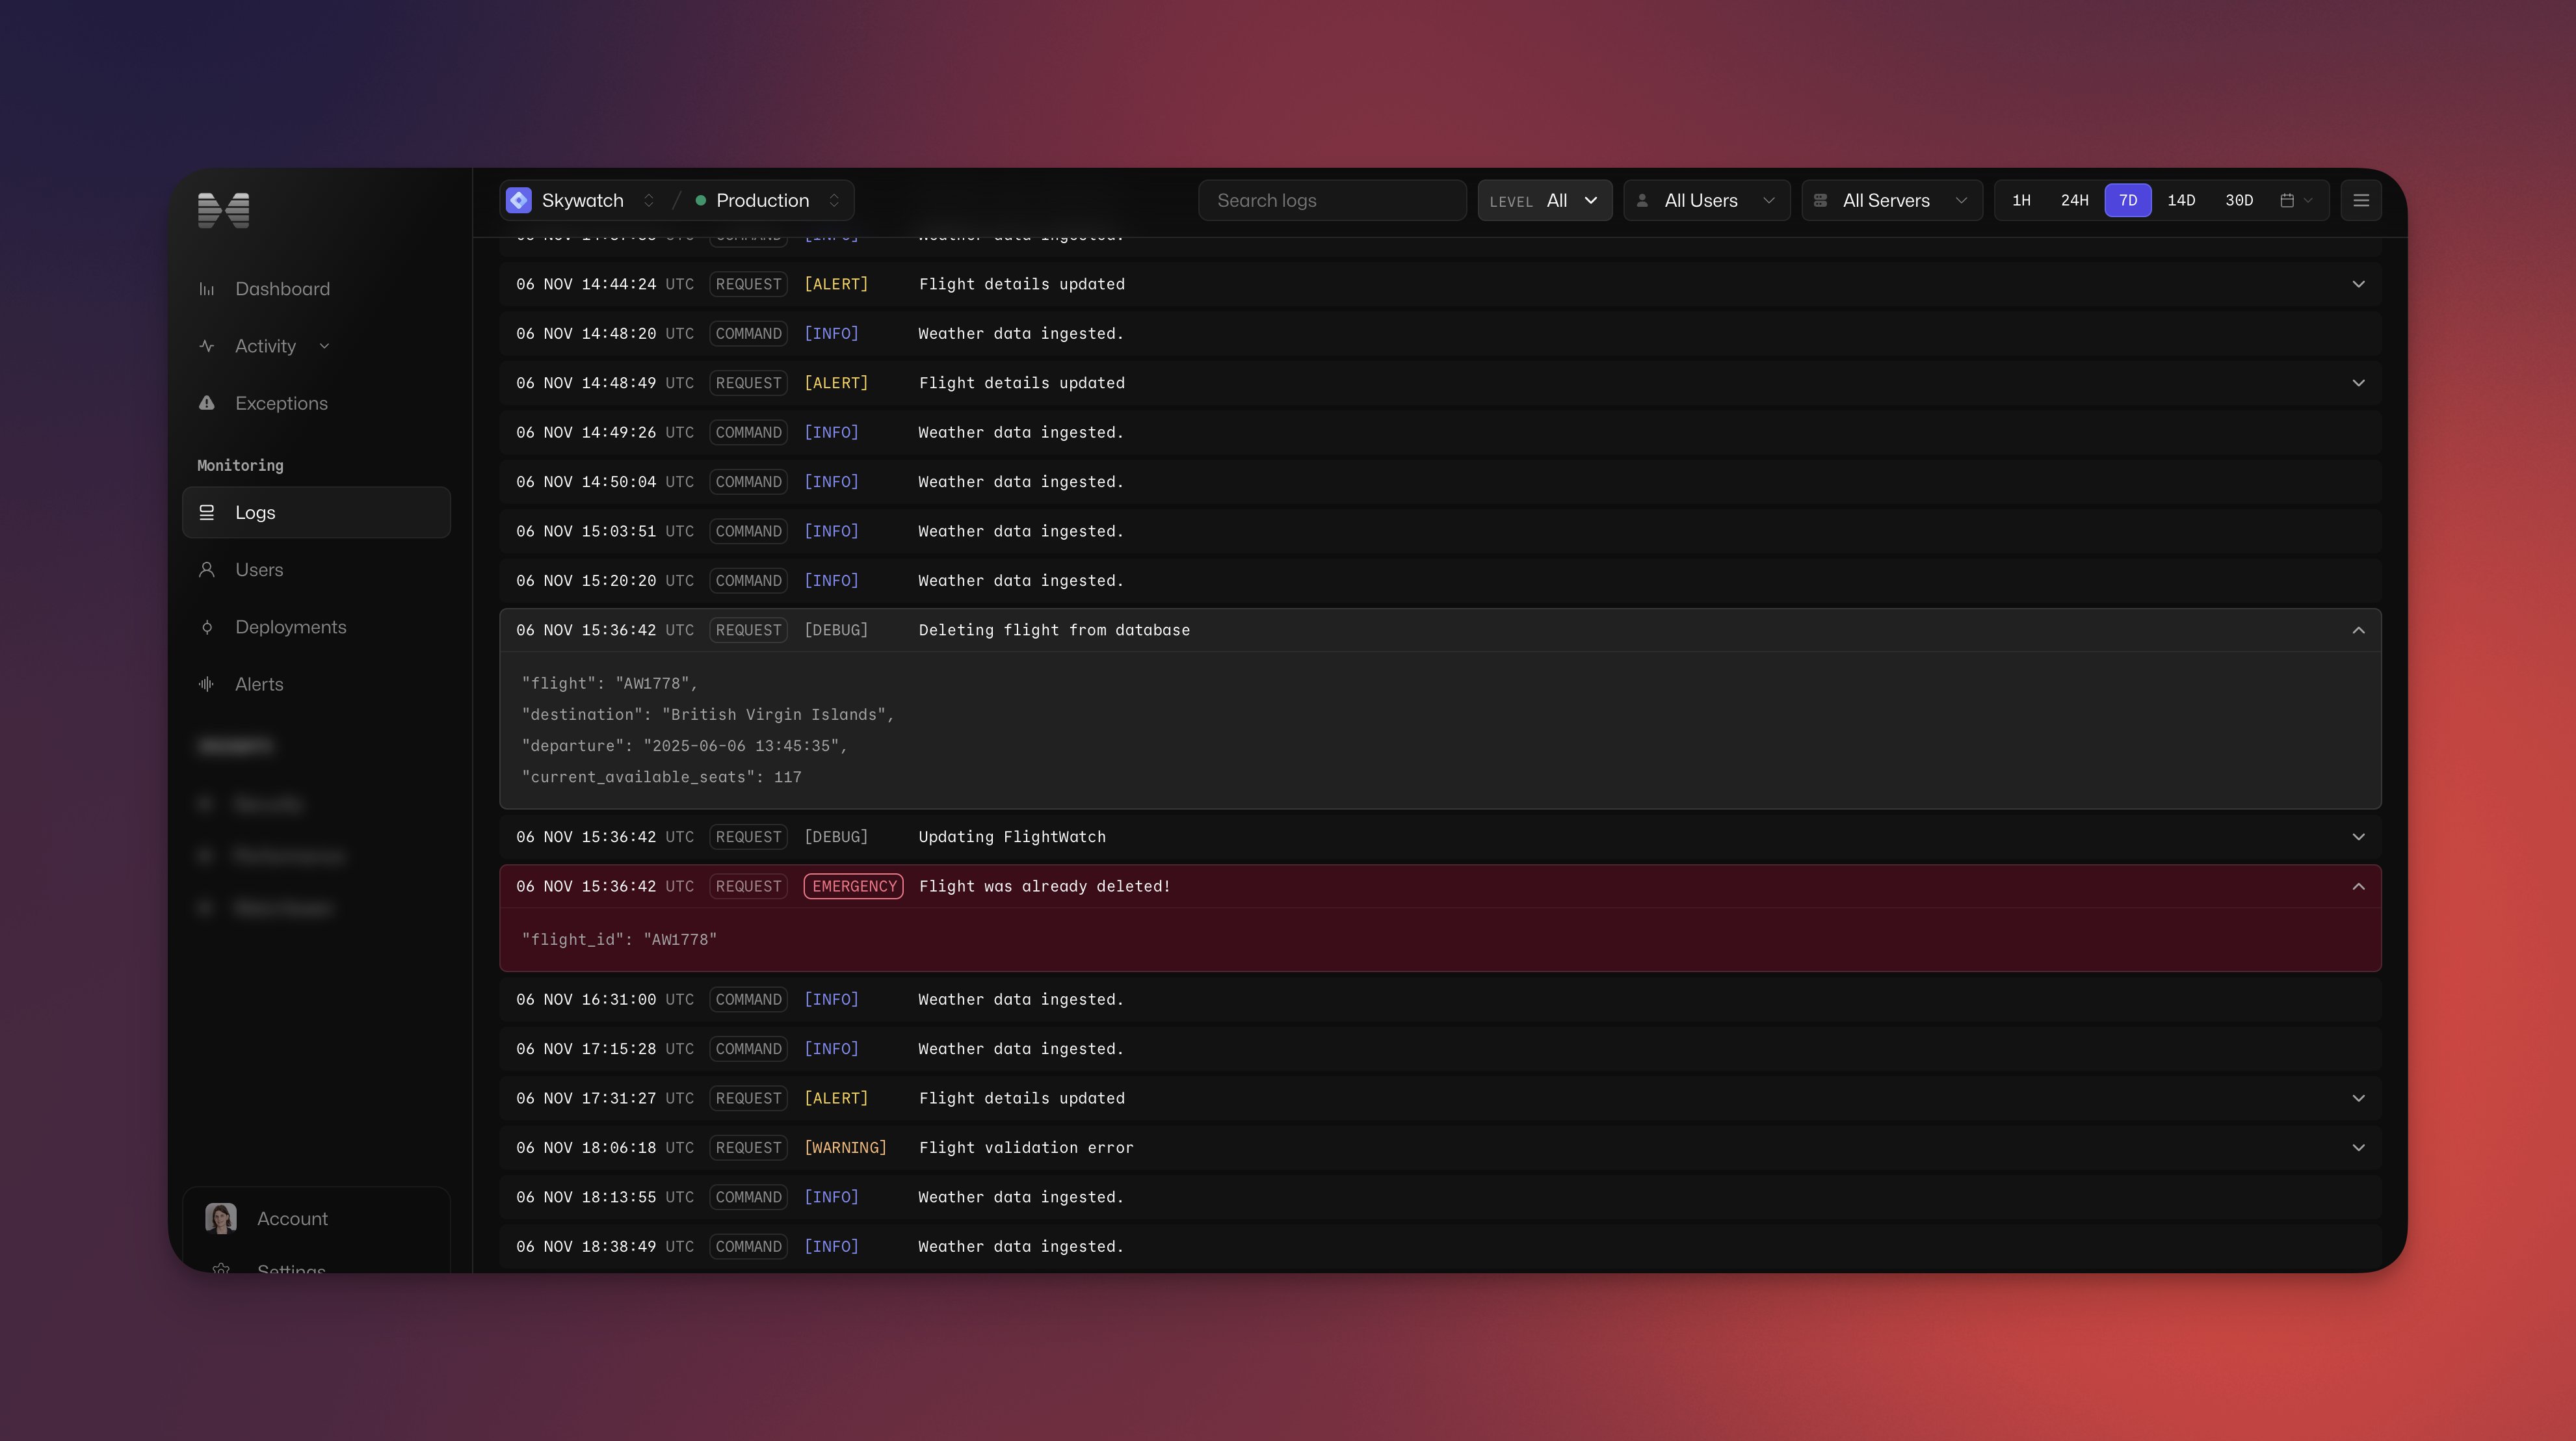
Application Logs with Contextual Insights: Nightwatch offers fast, intuitive log search capabilities, letting us filter logs by user and dig into log context. With Nightwatch, logs aren’t just standalone entries - they are integrated within the broader Laravel ecosystem, making troubleshooting faster and more effective.
-
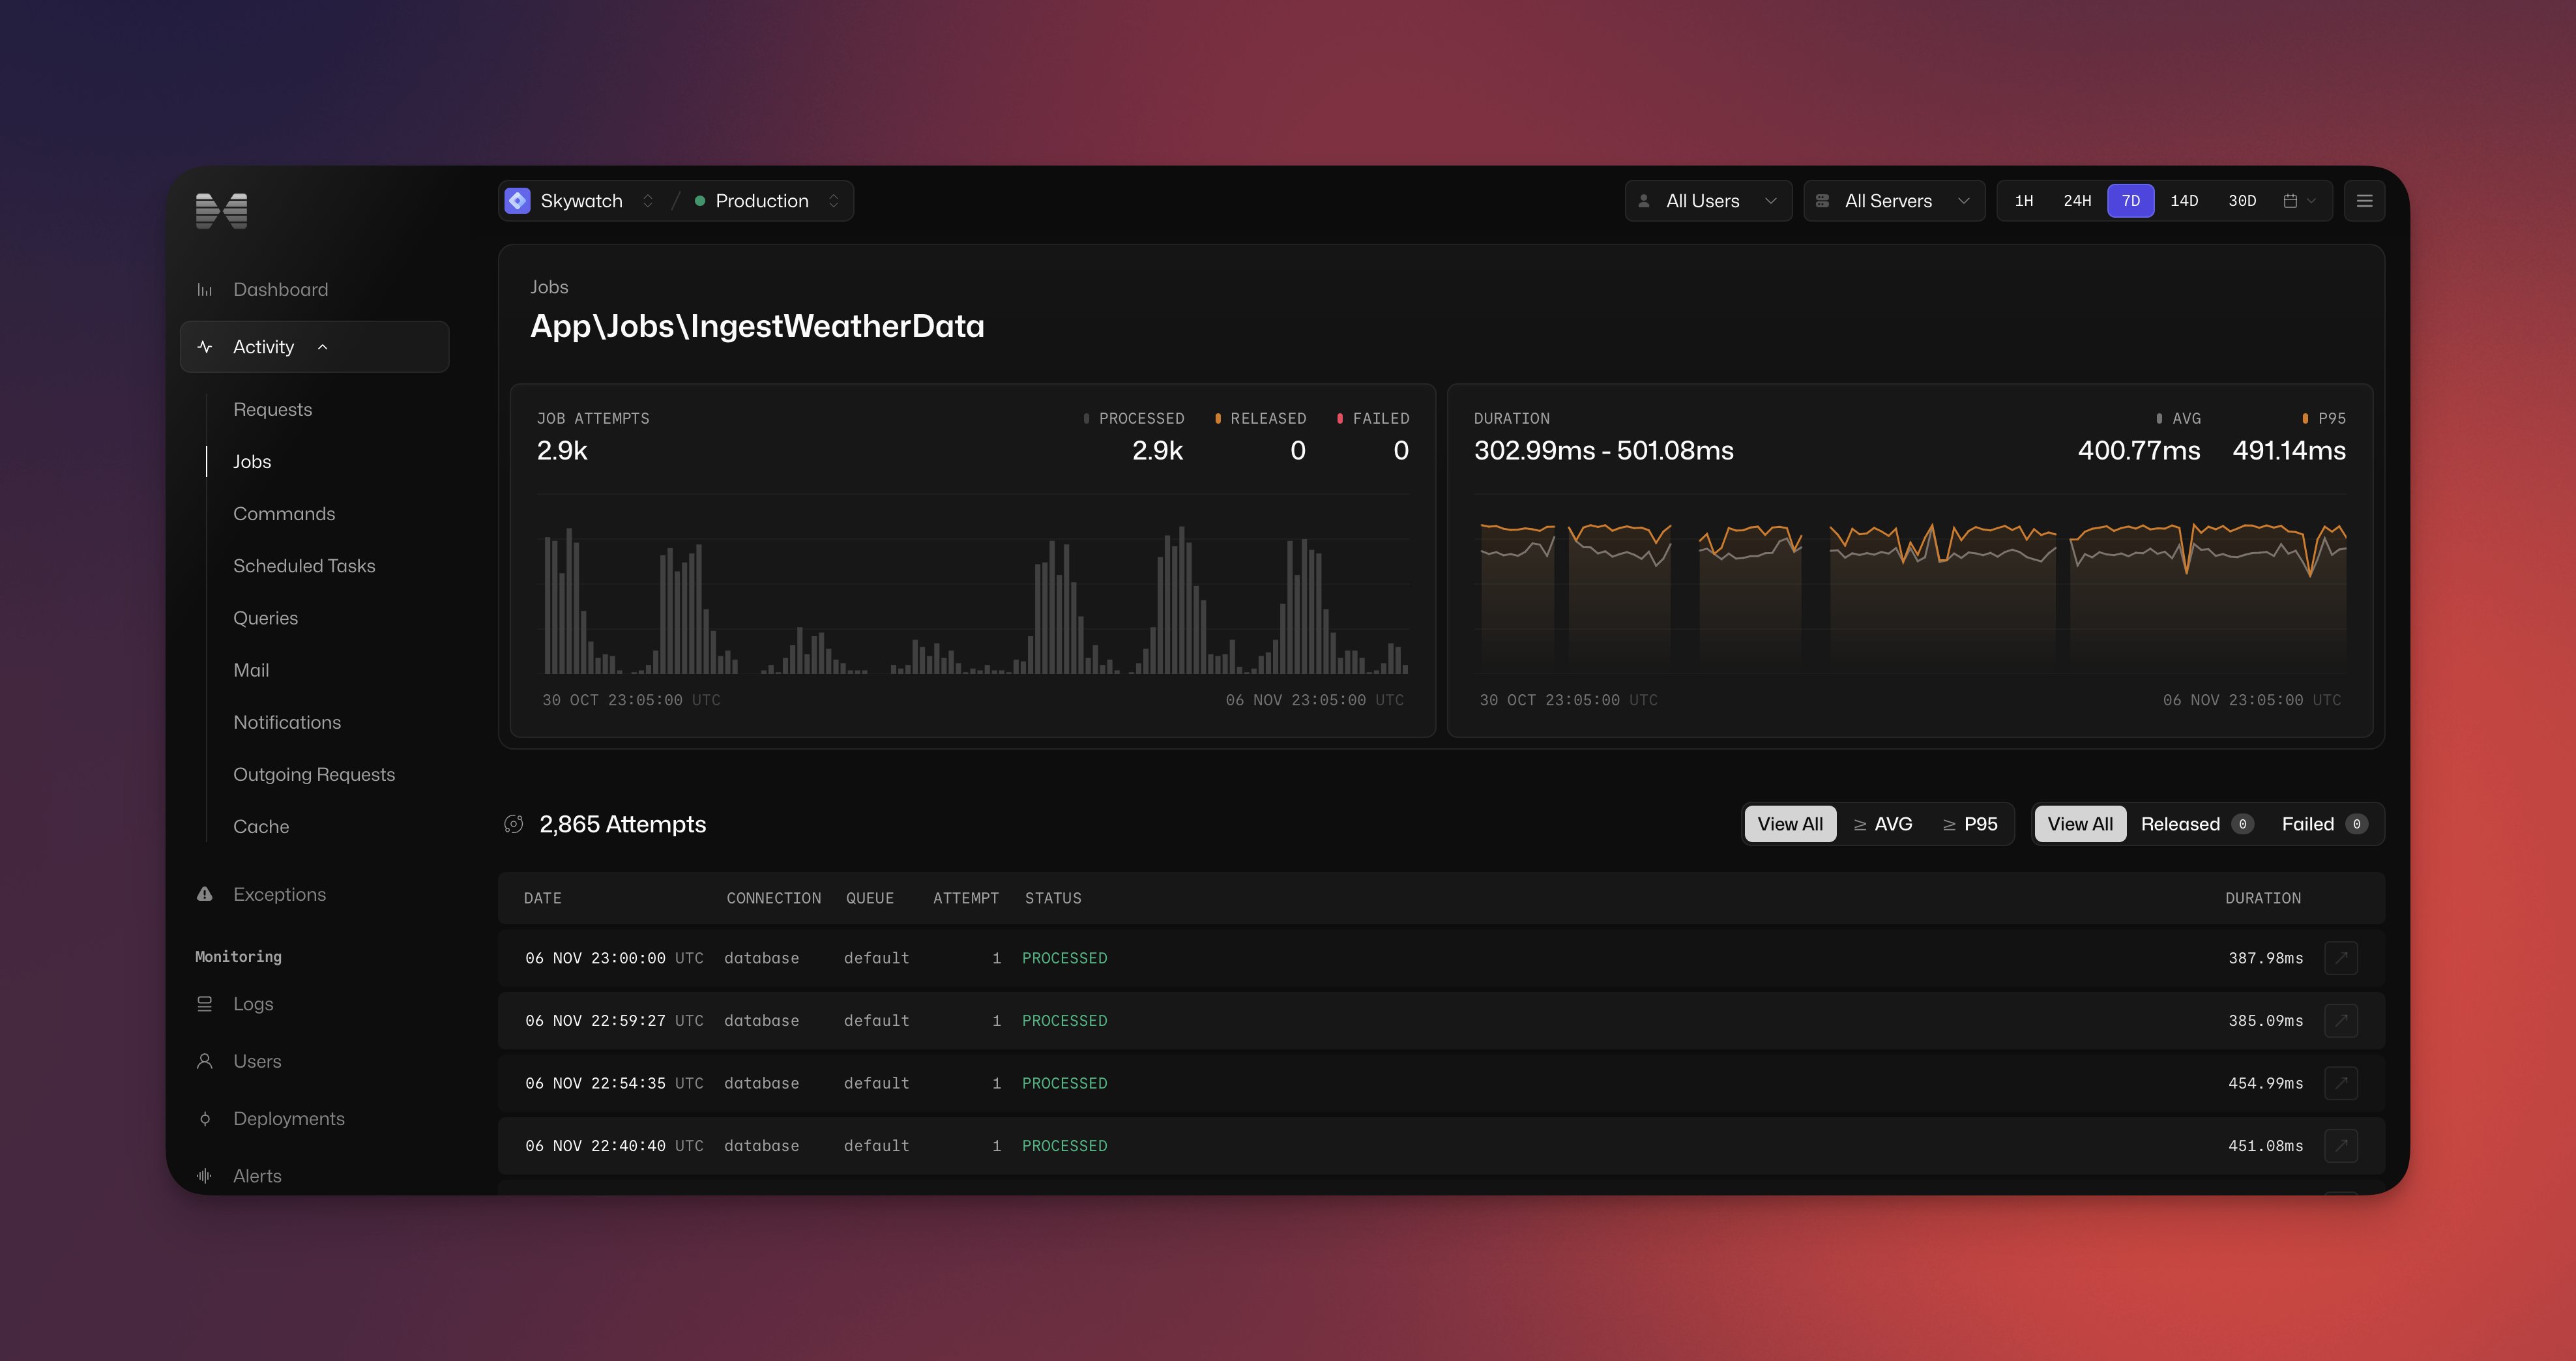
Queued Job Analytics: Nightwatch provides in-depth analytics on queued jobs, from high-level overviews of queue health to detailed performance metrics for individual jobs over time. This feature has the potential to replace Laravel Horizon for us, allowing us to diagnose job-related issues directly within Laravel Nightwatch.
-
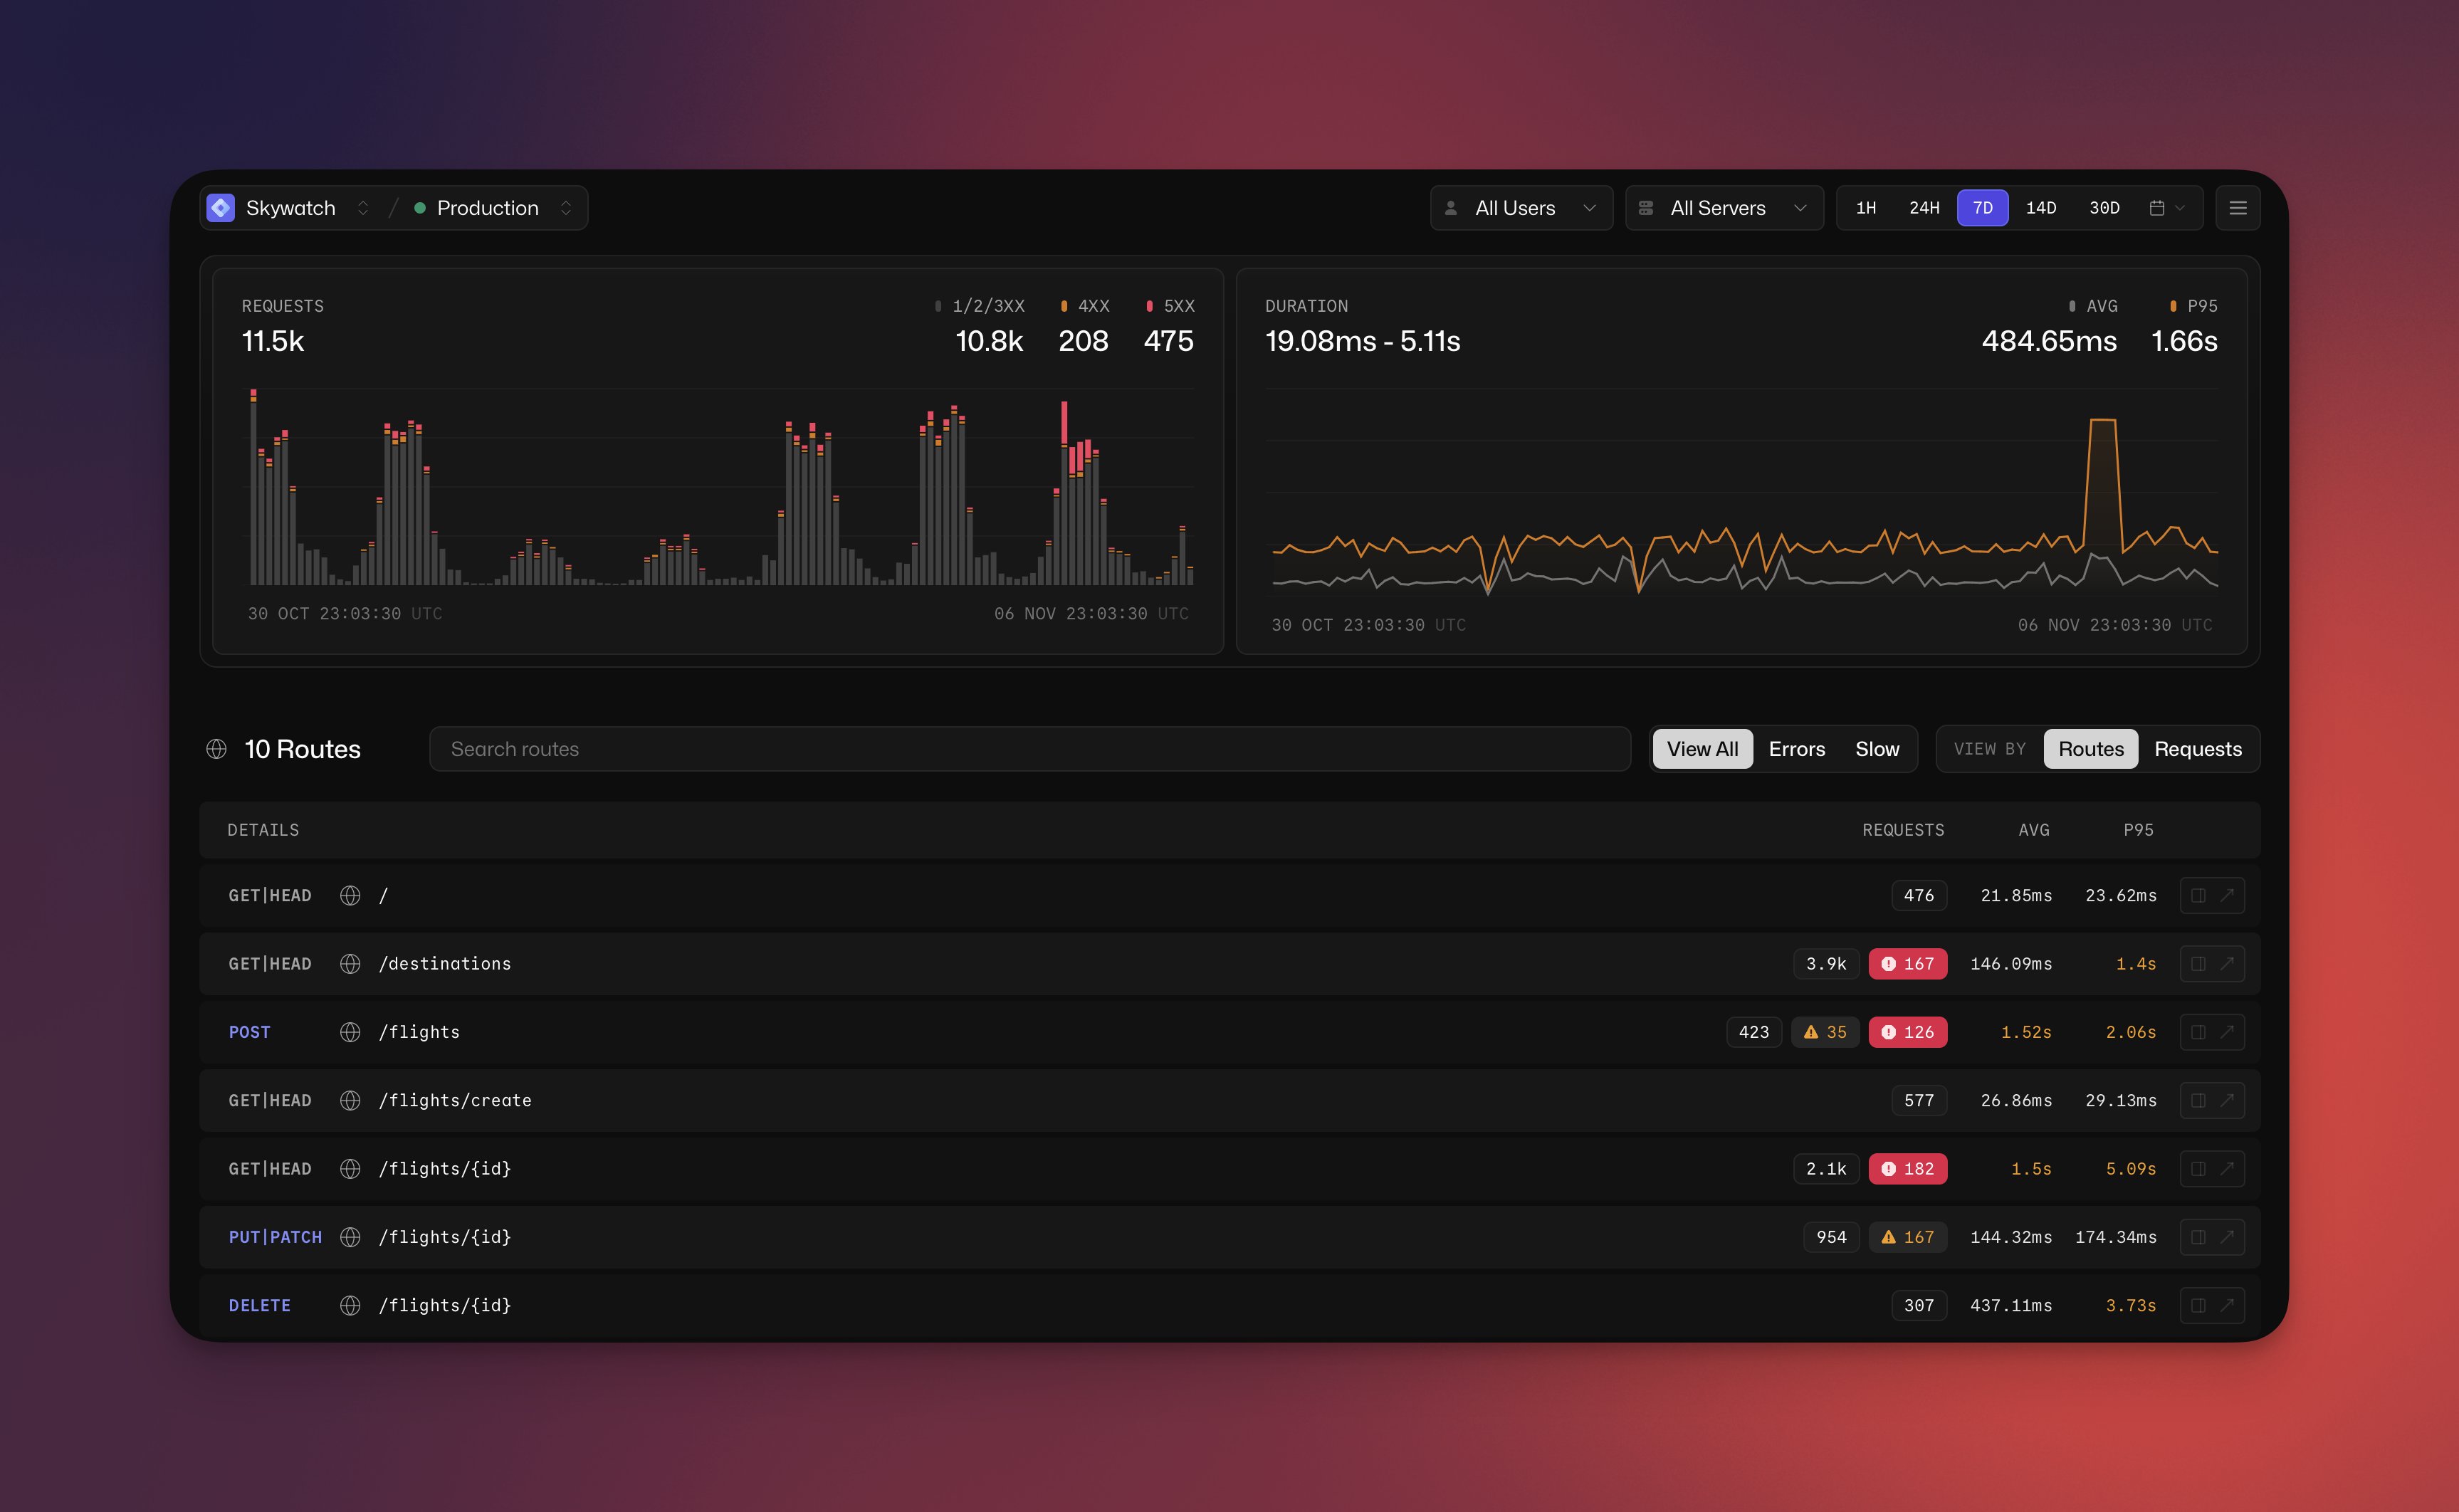
Route Analysis for Performance Insights: Nightwatch highlights application’s slowest routes and provides actionable insights for improving performance. This feature empowers developers to identify and resolve bottlenecks quickly, enhancing both speed and user experience.
-
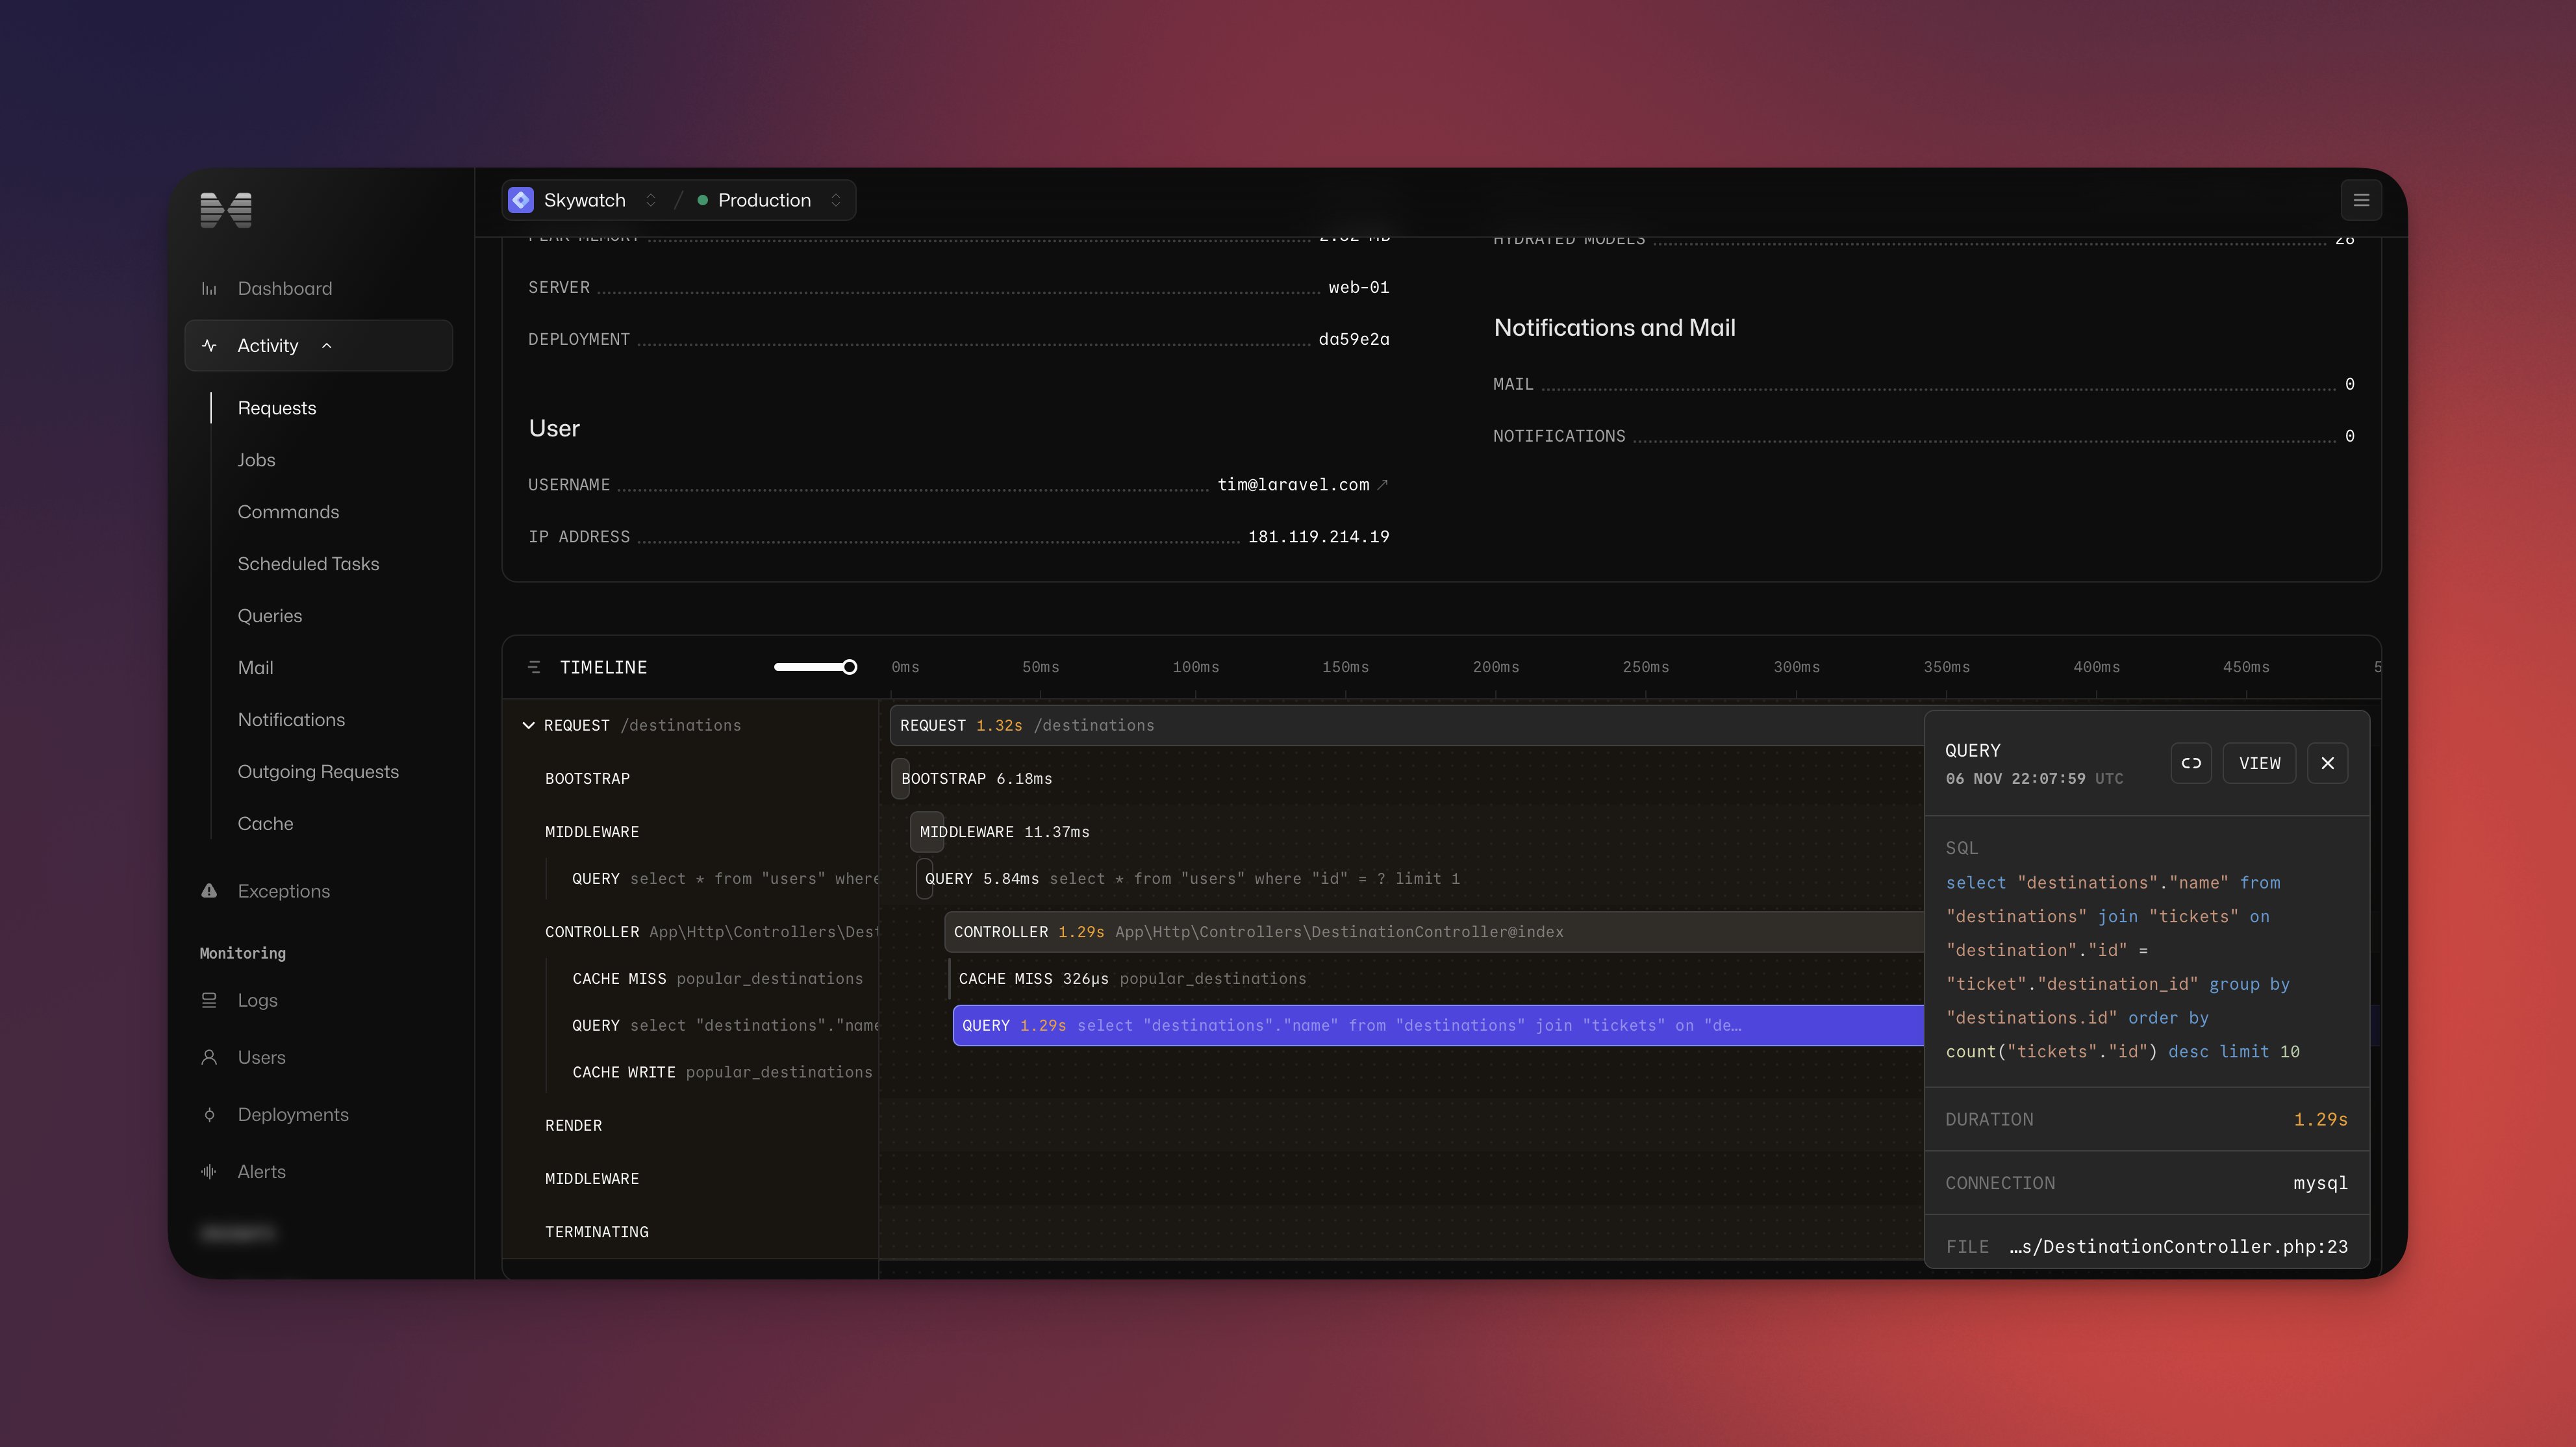
Request Profiling with Detailed Timelines: Each request is broken down into a detailed timeline that shows exactly where processing time is spent within the application. This feature helps pinpoint performance bottlenecks down to the query or middleware level, making it invaluable for optimizing application performance.
-
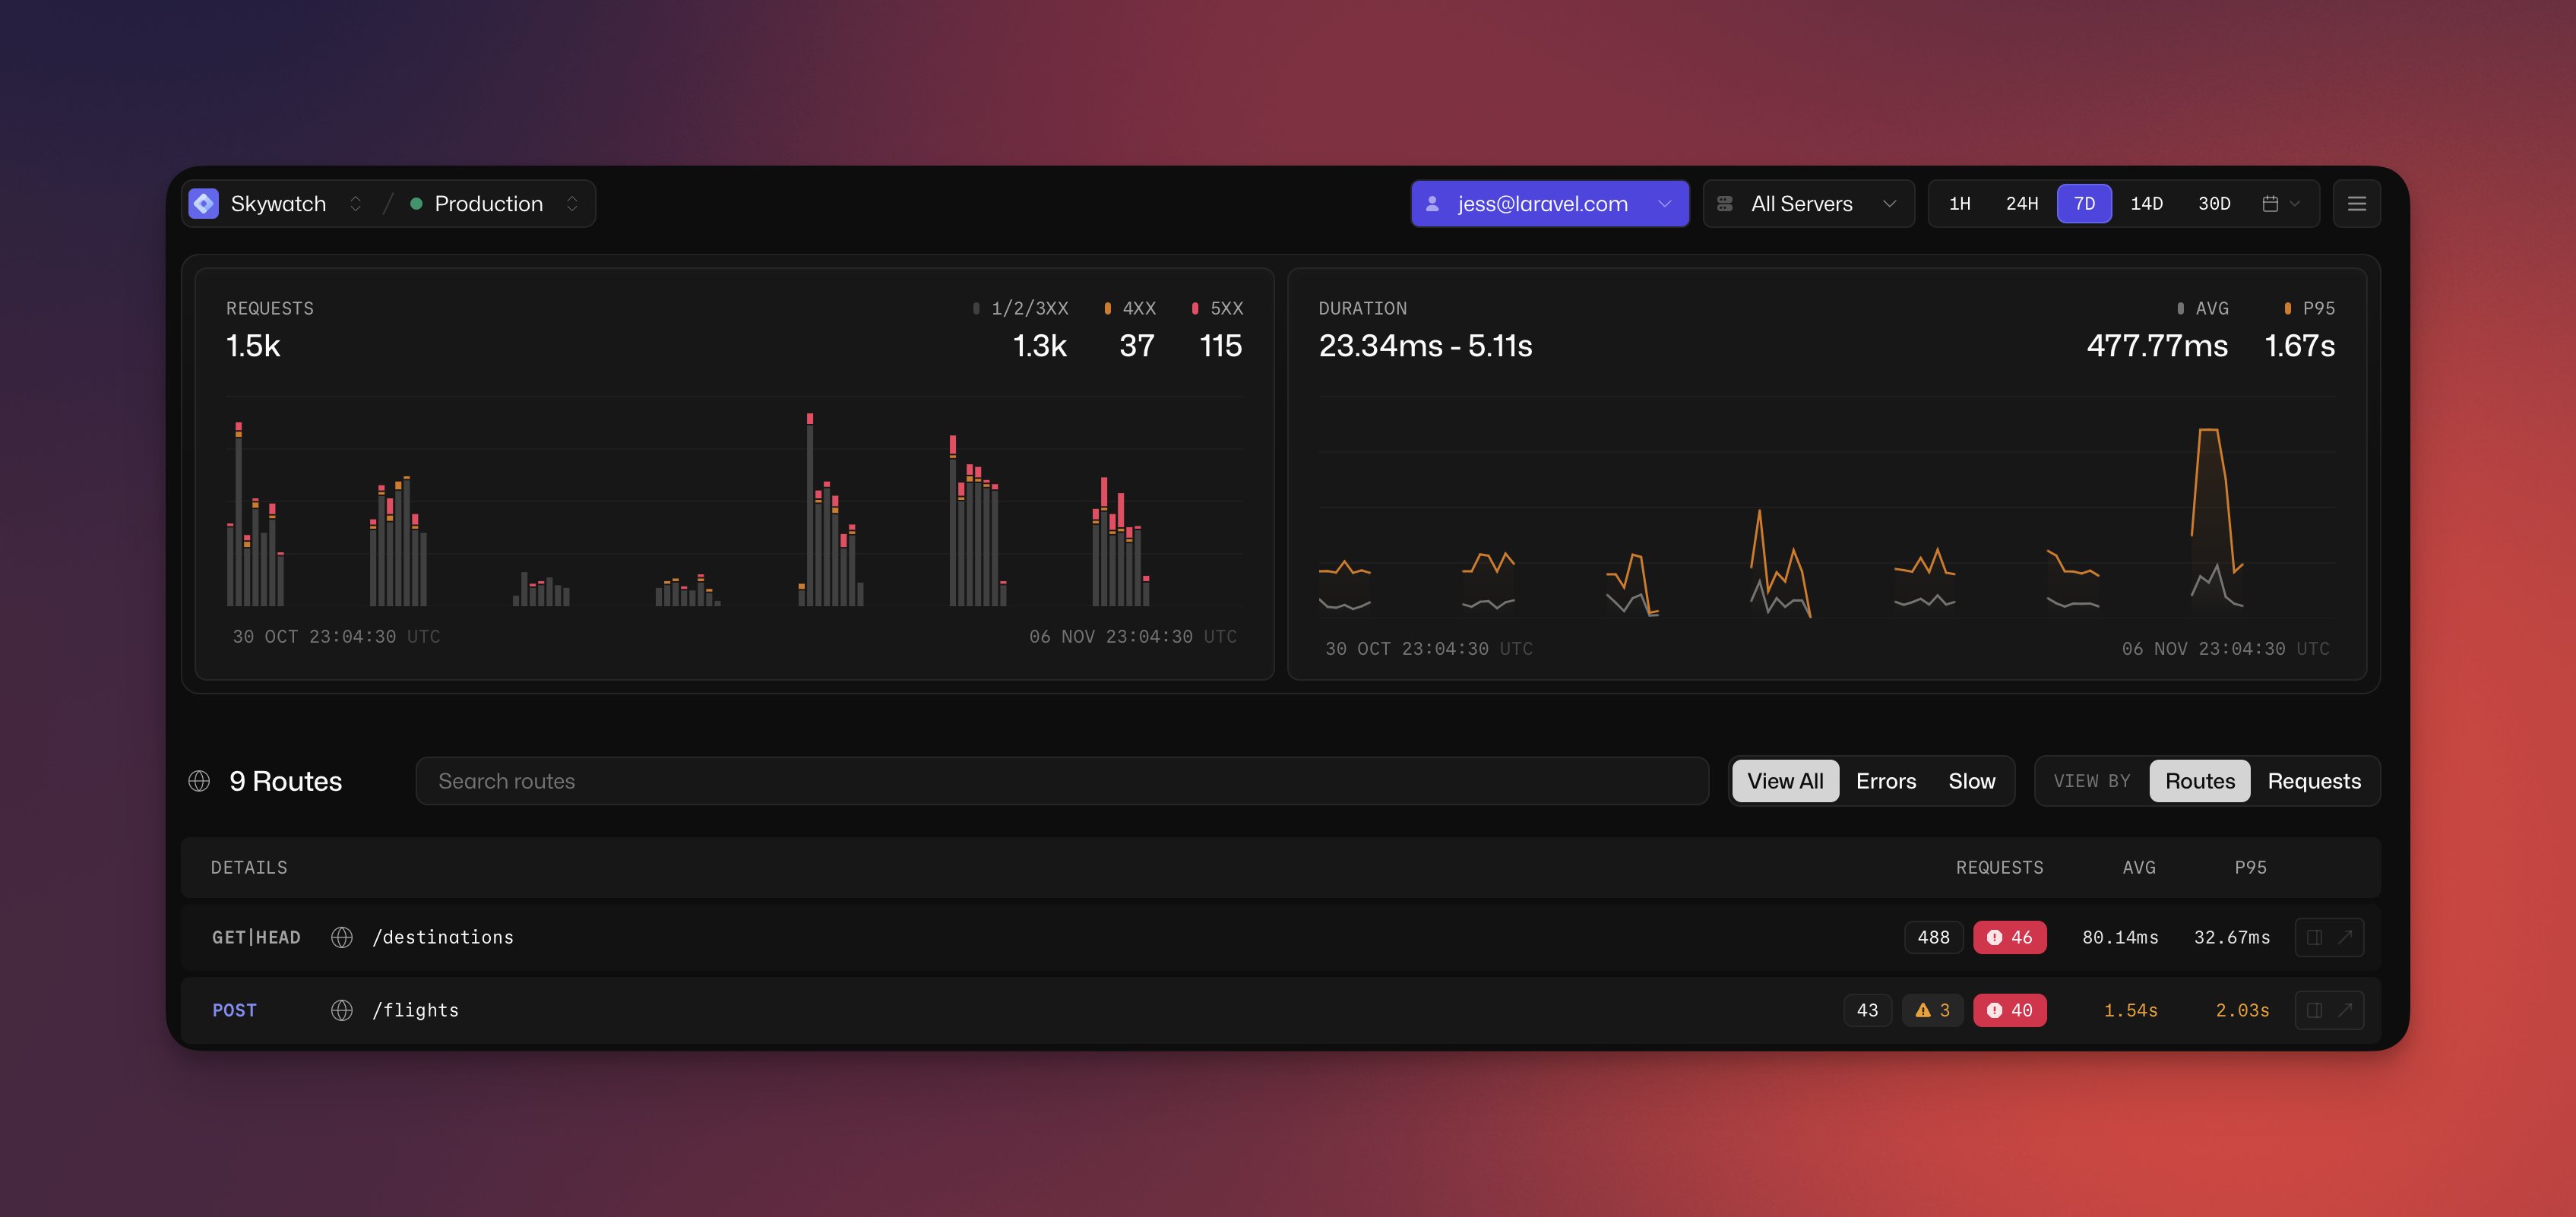
User-Specific Scoping for Customer Support: Nightwatch’s “scope by user” feature allows to diagnose issues on a per-user basis, which is a game changer for customer support. With this capability, we can quickly investigate and resolve issues reported by individual users, enhancing our response time and user satisfaction.
-
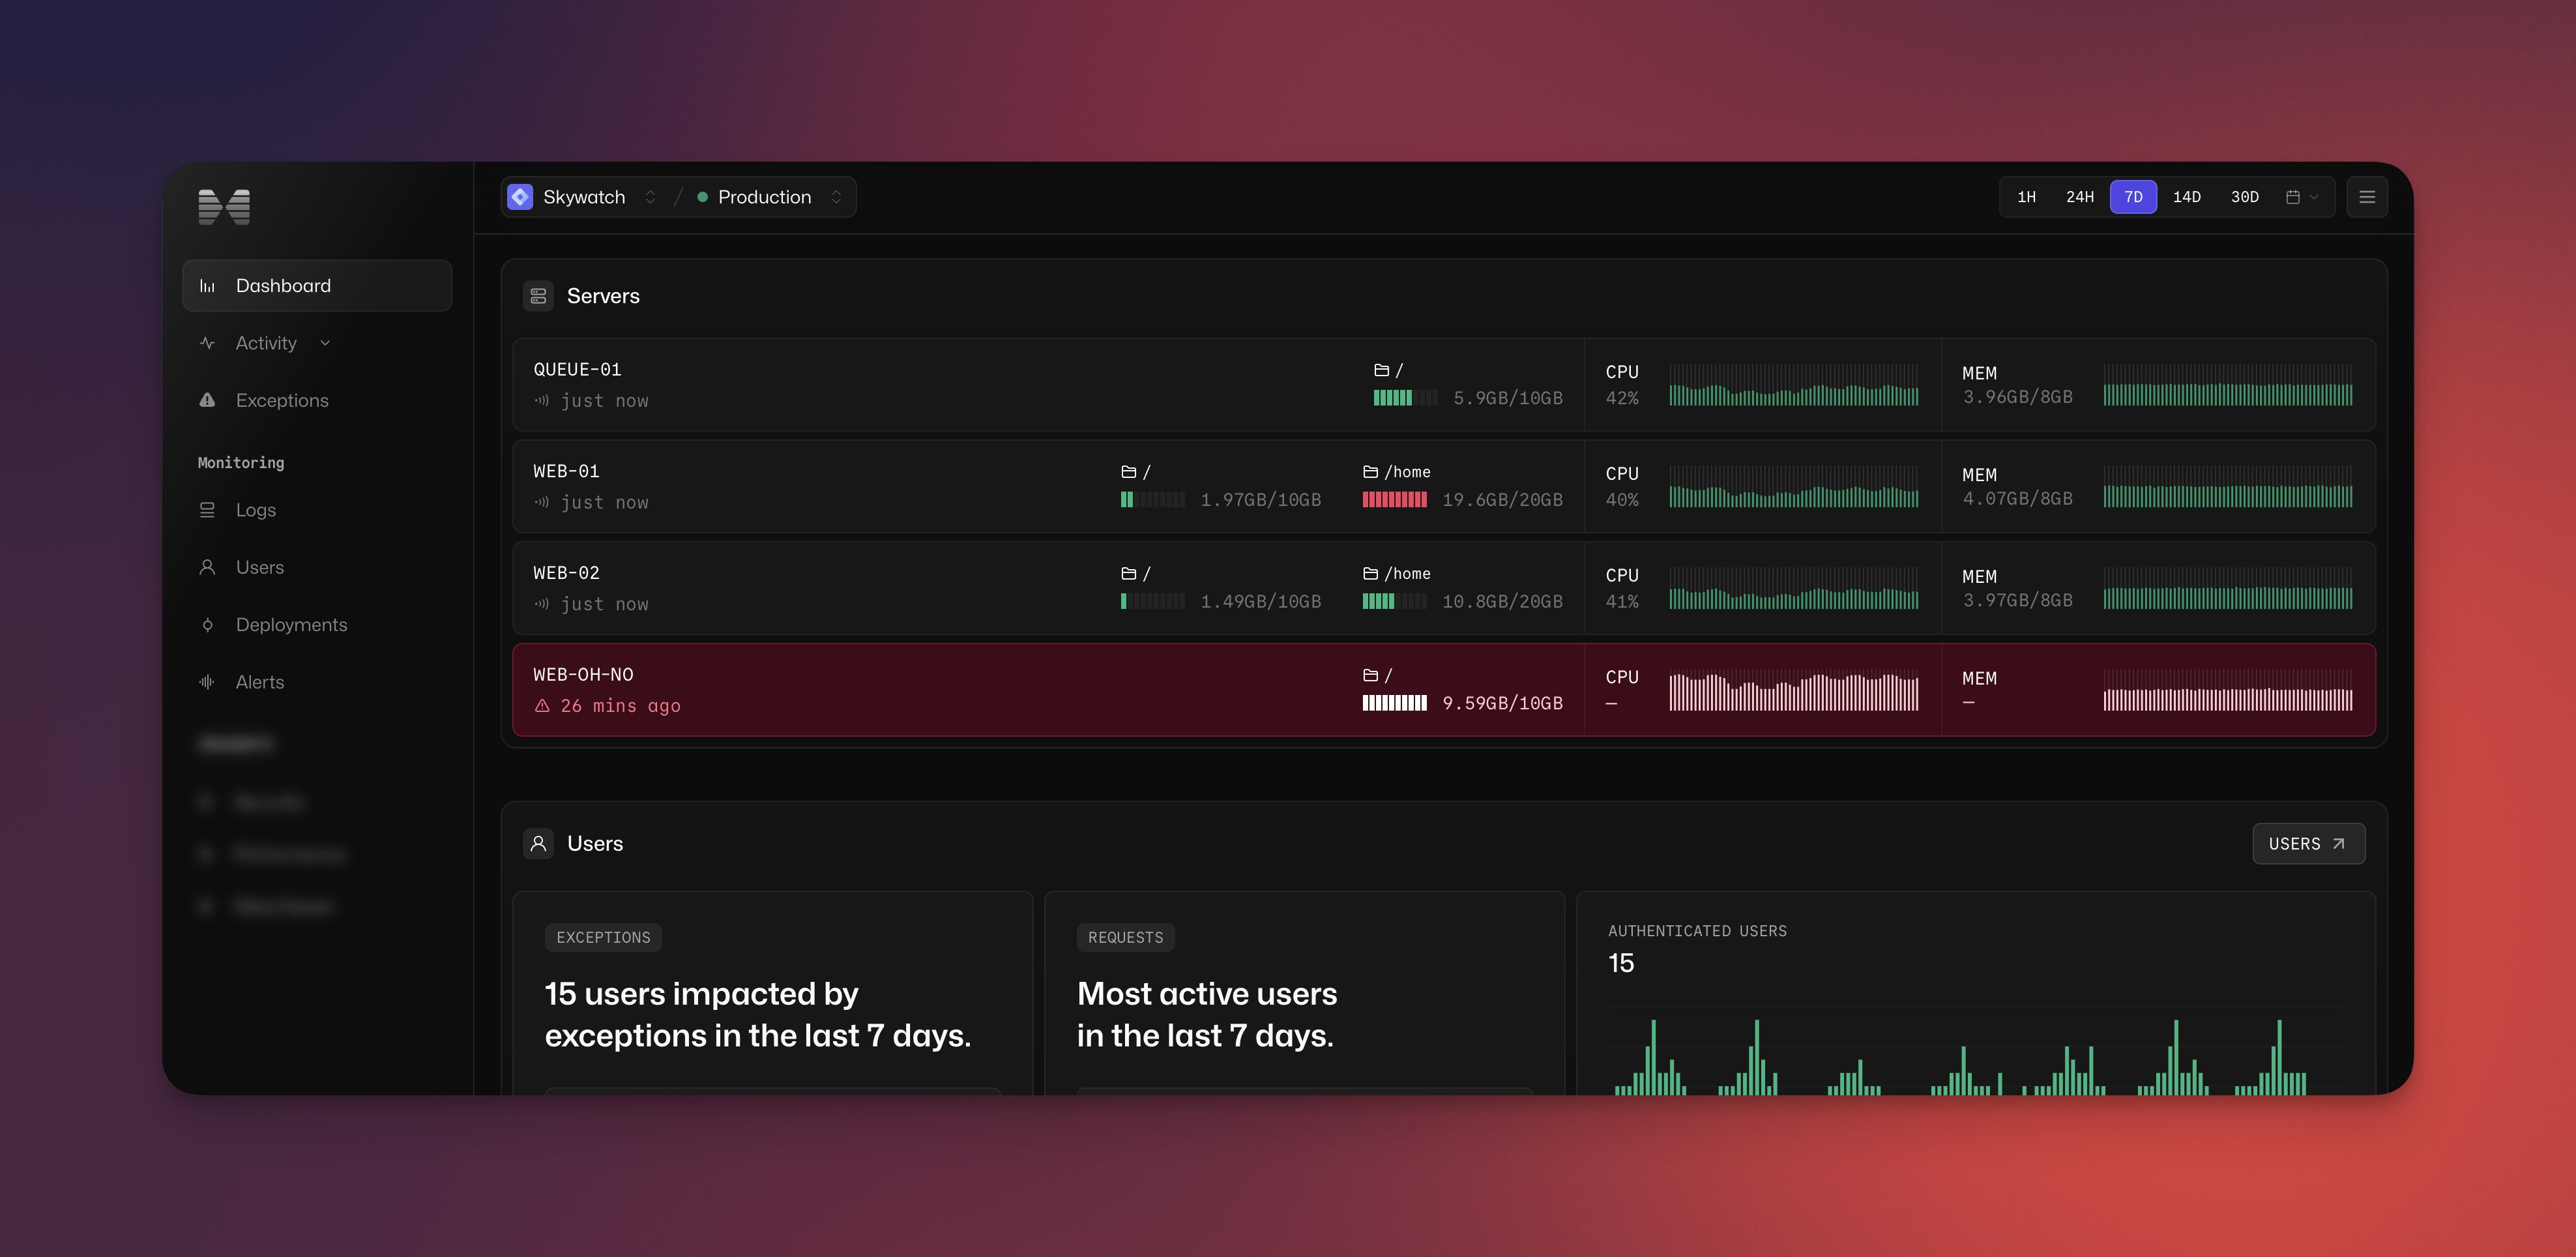
Server Health Monitoring (CPU, Memory, Disk Space): Laravel Nightwatch also provides insights into server health, tracking CPU usage, memory, and disk space. This feature gives us key infrastructure metrics, providing a real-time snapshot of server health directly within the Laravel environment.
If you haven't joined the waitlist yet, head over to the official website and be among the first to get access.
We’re excited to get our hands on Laravel Nightwatch as soon as it’s official and will be sharing our experience with you soon.

Meet the authors
We are a 200+ people agency and provide product design, software development, and creative growth marketing services to companies ranging from fresh startups to established enterprises. Our work has earned us 100+ international awards, partnerships with Laravel, Vue, Meta, and Google, and the title of Georgia’s agency of the year in 2019 and 2021.


.webp&w=1920&q=75&dpl=dpl_6fFrZ1Vo4yAss5y58d9qcMHVsKyy)

