6 min read
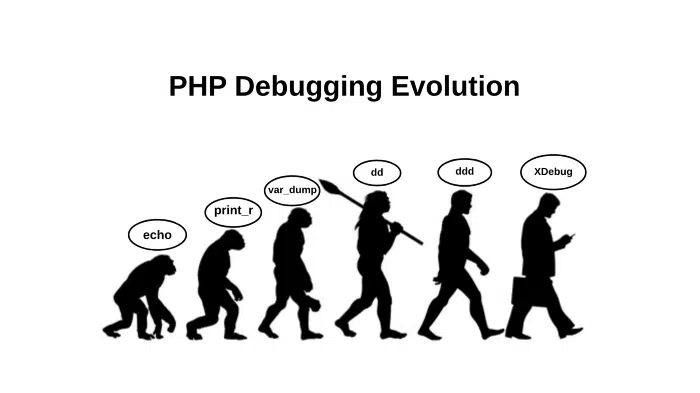
XDebug, Debugging PHP with God Mode
Delivery Manager & Software Architect
An integral part of the development process is identifying and eliminating bugs from the codebase.
We have quite an array of debugging methods in PHP. We can use various debugging tools and libraries starting from echo and ending with CodeSniffer and static analysis tools that protect us from increasing the number of bugs and help us identify and liquidate them.
Let's dive into some examples of the traditional debugging methods.
Traditional Debugging Methods
First of all, the echo and print methods are the simplest and most frequently used debugging methods that prints the variable that we indicate:
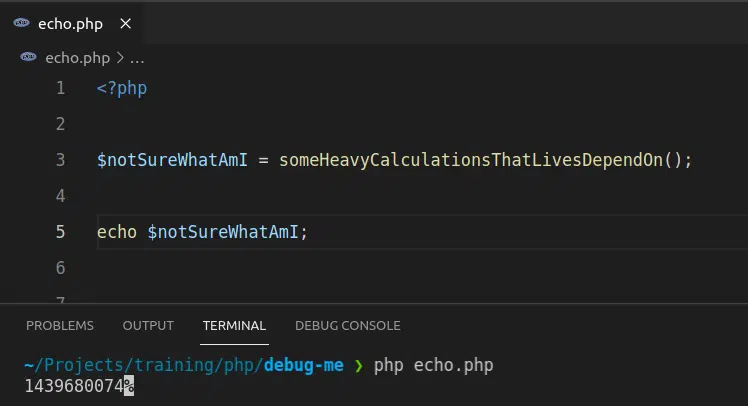
It indeed does its job. It brings the value of the variable to us. However, it is impossible to use echo and print for debugging purposes in most cases since they can only print primitive variables such as strings, whole numbers, and decimals.
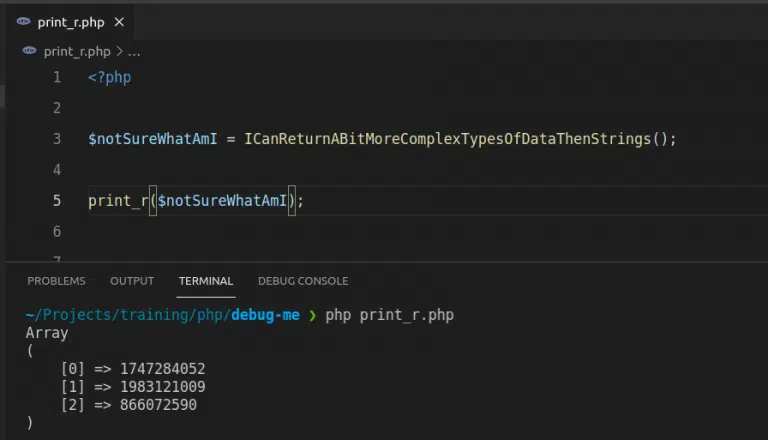
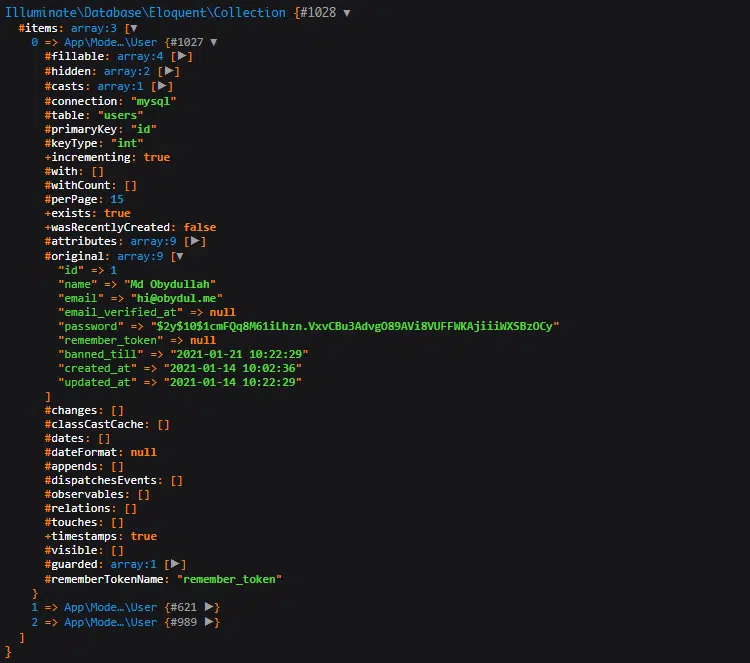
The next asset in our debugging arsenal is print_r. Print_r can print both complex and straightforward types of variables such as arrays and objects:
Another debugging method that's quite similar to print_r is var_dump. However, unlike print_r, var_dump also applies types to the printed values:
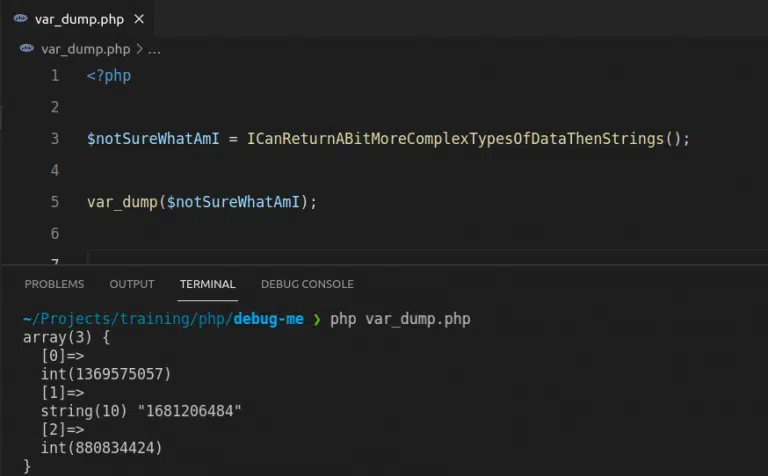
However, most of the developers prefer print_r cause it is more readable.
If you're a Laravel developer, you are familiar with Double D and Triple D.
DD — Die and Dump
This function lets us analyze both complex objects and simple variables. On top of that, the appreciable feature of dd is that it prints more beautifully and in pretty colors.
Laravel also offers us new Debug techniques.
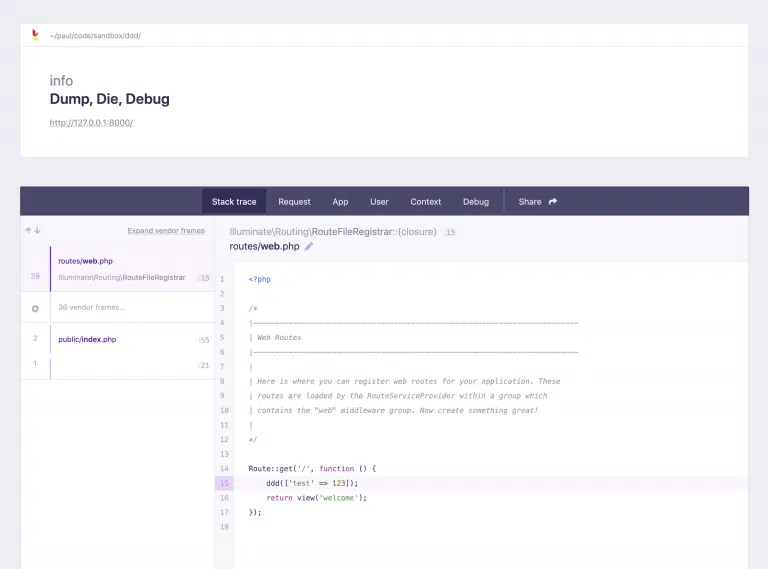
DDD — Dump, Die, Debug.
This tool does the same thing as dd, but it's prettier and has a Stack Trace.
However, what happens if we have a huge codebase and there is a bug somewhere? Do we use var_dump and DDD on every step until we find that damn bug? Sure, that's definitely an option, and that's what many PHP developers do in most cases.
But why waste so much time when there is a more comfortable way of doing this? Let me introduce you to Derick Rethans, creator of the XDebug extension. XDebug allows us to examine our application, use it as a PHP debugger, analyze it, profile it, etc. Now let's talk about one particular functionality of the XDebug known as Step Debugging.
What is Step Debugging?
Step Debugger is a feature of XDebug that allows us to execute our code interactively, pin breakpoints, suspend the code execution, analyze variables directly in IDE, etc.
Here you can see the documentation for the XDebug installation: https://xdebug.org/docs/install.
How does Step Debugging Work?
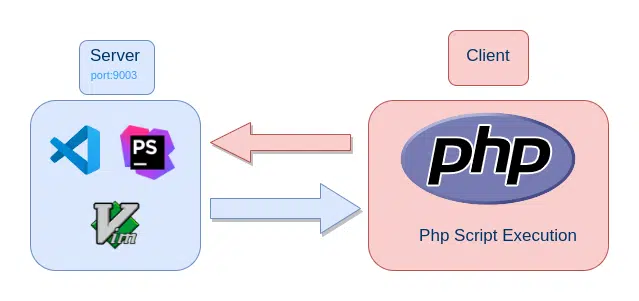
The Step Debugging technique is an implementation of the good-old client-server communication model. In this case, the server is our IDE (for example, VSCode, PHPStorm, or Vim), which listens to HTTP requests on port 9003. And our PHP Script execution process is the client that will communicate with the server. After installing XDebug, it becomes part of the PHP interpreter.
This is how the process goes: first, PHP Script sends a check request to IDE to ensure the 9003 port is open to HTTP requests. Then, at every PHP script execution, it sends a check request before PHP starts executing the instructions. With that request, XDebug finds out whether any server is listening to requests on the 9003 port.
If it finds that one of the IDEs is listening to requests on the 9003 port, then XDebug sends another request - Get Breakpoints. IDE then answers with a list of breakpoints that exists in the codebase.
Once the PHP execution process comes across an instruction that IDE has identified as having a breakpoint, it pauses the code execution and sends a new request to the IDE - "I just reached the instruction you told me about; what should I do next?"

Then we can just use the Debug Instruction Panel to tell PHP Script what we want it to do.
And just like that, with Requests & Responses, IDE and PHP Script communicate with each other.
Configuration of XDebug
As we have already mentioned, two sides are involved in the PHP debugging process:
* Client (PHP Script Execution)
* Server (IDE: VSCode, PStorm, Vim…)
Therefore, we need to configure both sides. When we install XDebug, a new .ini file will be created in which we can enter additional configurations.
Insert in the terminal:
![]()
The output will contain the addresses of PHP .ini files, one of which belongs to XDebug.
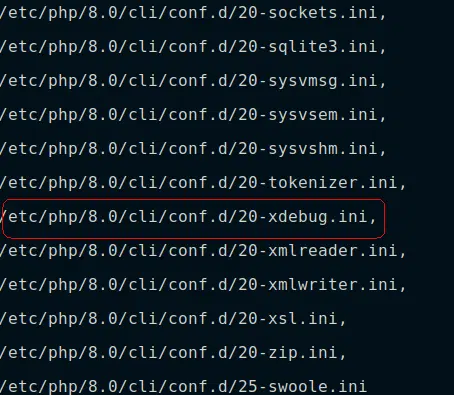
If we look at the XDebug .ini file, we will see that the XDebug extension is activated.
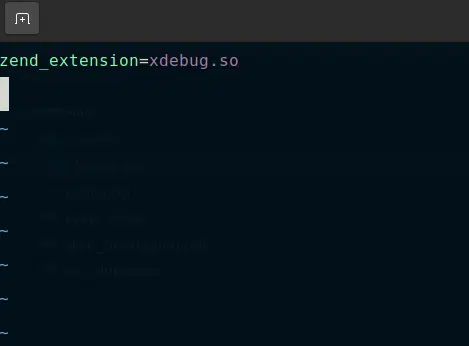
We will need to add one or two configurations in this .ini file:
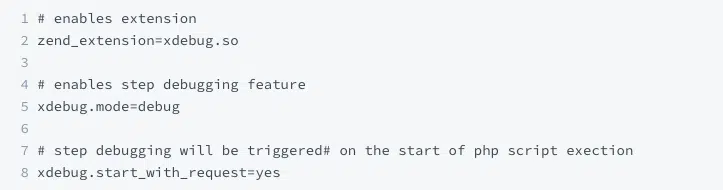
And the XDebug configuration is ready!
The configuration of XDebug may change depending on the development environment. This example is based on the standard approach when PHP Interpretator and IDE are installed on the same machine locally. But, for example, if you use vagrant or Docker in the development process, PHP will connect from a virtual machine or container to our IDE on our host machine. And in this scenario, the configuration will be a bit different.
Before we configure the VSCode, we must ensure that the extension required for PHP debugging on VSCode is installed.
https://marketplace.visualstudio.com/items?itemName=felixfbecker.php-debug
Now we can open our project folder and use the Ctrl+Shift+D shortcut to request the Debug Panel.
The shortcut on the Mac is CMD+Shift+D.
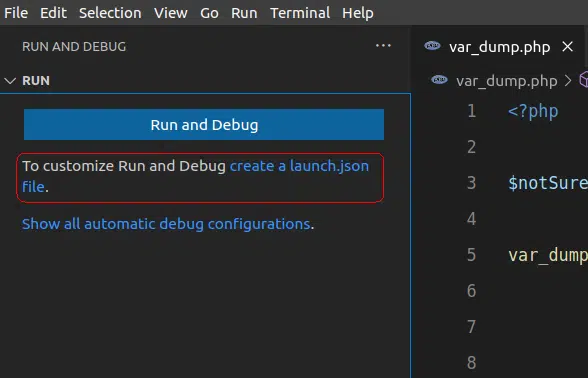
Using the "create a launch.json file" button, we create a VScode configuration which looks like this:
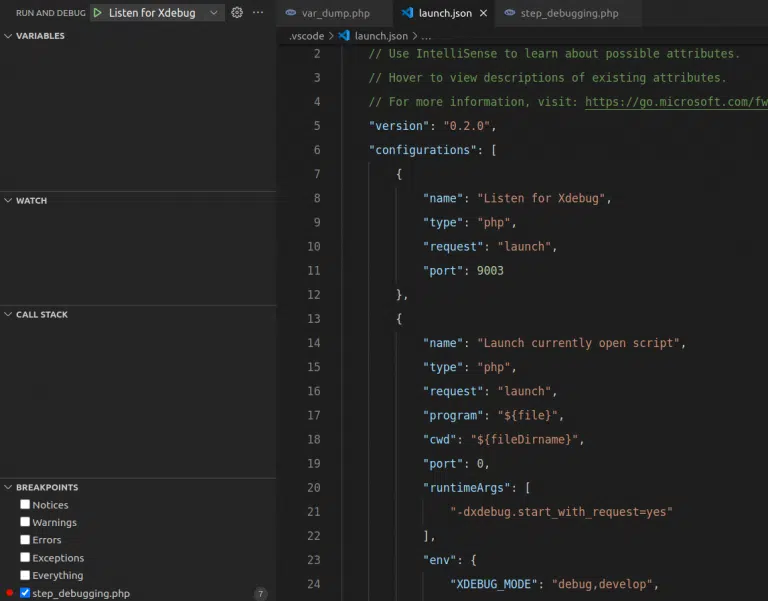
VSCode will create a .vscode folder in our project and then launch.json file in this folder. There are three ready-made configurations in the launch.json file. In this case, the first one is the only one we will need (Listen for Xdebug).
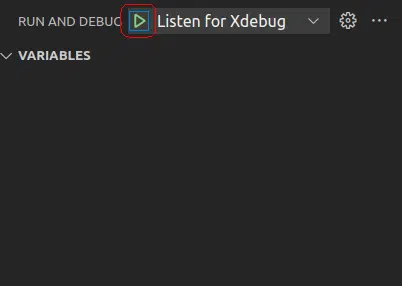
With the start or F5 button, we can run the Debug Server, which will listen to 9003 port requests.
Then we can set the breakpoints in our codebase and run the PHP script (or PHP Server) ?
Happy DeBugging! ?
Written by Giorgi Giunashvili
Translated by Keti Getiashvili
About the author

Delivery Manager at Redberry
Co-founded Redberry's Laravel Bootcamp
Built E-space, EV Marketplace
Giorgi is a Software Architect and Laravel engineer at Redberry who has delivered production platforms across EV mobility, banking, car rental, and professional-services SaaS. He built E-space, an EV-charger marketplace, the ProCredit Bank website, and Skippit, a multi-tenant ERP for professional-service firms. He also co-founded Redberry's Laravel bootcamp and authors the company's PHP and Laravel developer tutorials.
Last updated on Jul 21, 2026 by

Trending News
Hosting the First Official Laravel Meetup in Georgia
We hosted the first official Laravel Meetup in Georgia, bringing together more than 100 attendees for an evening dedicated to Laravel, engineering, and community.
Hosting a RDBR Meetup on Our Tavistock Protect Partnership
At our latest RDBR Meetup, we looked inside our two-year partnership with Tavistock Protect and the product we have been building together: PP Mobius.

Meet the authors
We are a 200+ people agency and provide product design, software development, and creative growth marketing services to companies ranging from fresh startups to established enterprises. Our work has earned us 100+ international awards, partnerships with Laravel, Vue, Meta, and Google, and the title of Georgia’s agency of the year in 2019 and 2021.


.webp&w=1920&q=75&dpl=dpl_9xQxFYDVmEx871eGvoCPifh1CjuD)